
Today, we will dive into some strategies you can use to scale Ruby on Rails applications to a huge user base. One obvious way of scaling applications is to throw more money at them. And it works amazingly well - add a few more servers, upgrade your database server, and voila, a lot of the performance issues just go poof!
But it is often also possible to scale applications without adding more servers. That’s what we will discuss today. Let’s get going!
Use AppSignal for your Rails Application
Before we dive into scaling and performance optimization, you first need to identify if you need to do this, what the bottlenecks are in your application, and what resources can be scaled. One easy way to do this is to use AppSignal’s performance monitoring and metrics for Ruby. The ‘Performance Monitoring’ dashboard helps you pinpoint the exact controller actions and background jobs that are slow on average.
For example, here’s how a performance dashboard might look for ActiveRecord:
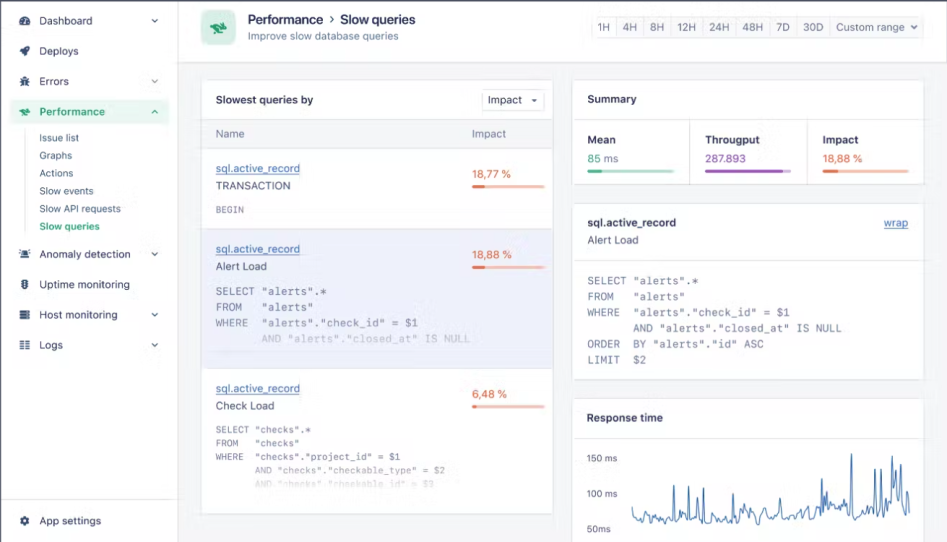
This gives you a good starting point to start any scaling journey, whether by deciding where to add more servers or optimizing performance through code. Now let’s move on to one of the simplest techniques you can use to scale your Rails app - caching.
Caching in Ruby on Rails
Caching allows you to stop computing the same things again and again. For example, let’s say you run a social media platform, and there’s a very popular post. Caching can immediately help you regain all the CPU cycles you spend rendering that post for every user. And that’s only a part of what caching can help you do. Let’s look at all the possible resources that can be cached.
Caching Views
Rendering views can sometimes be an expensive operation, especially when that view has a lot of data to be rendered. Even when the operation isn’t expensive, using a pre-rendered view will give you a lot of performance as opposed to rendering that same view a million times.
Rails supports this out of the box using the cache view helper. For example, this is how it can cache each post when rendering a list:
<% @posts.each do |post| %>
  <% cache post do %>
    <%= render post %>
  <% end %>
<% end %>
For this, Rails automatically caches each post under a specific key that depends on the HTML content of the template, post id, and update timestamp. To read more about this technique, check out the posts Fragment caching in Rails and Rails collection caching. One thing to keep in mind, though, is that the cache keys don’t include nested template content. So if you are nesting the cache calls deeper than one level, there might be stale results. Read more about this in Russian doll caching in Rails.
Caching Responses
In addition to caching views/fragments, you can also choose to cache the full response of GET requests. This is supported through the If-None-Match and If-Modified-Since headers sent by the browsers.
When an If-None-Match header is present on the request, the server can return a 304 Not Modified response with no content if there are no changes to the response. The server-computed Etag is compared with the value inside that header.
Similarly, if the If-Modified-Since header is present without an If-None-Match, the server can return a 304 Not Modified response with no content (as long as the response hasn’t changed since that date).
Rails provides easy ways to do this inside controller actions. You can simply write:
class PostsController < ApplicationController
  def show
    @post = Post.find(params[:id])
    fresh_when last_modified: @post.updated_at.utc, etag: @post
  end
end
Rails will send all the required headers to support caching, handle incoming headers, and respond with 304 when the data hasn’t changed. The server can skip rendering the full views again unless things change. You can read more about advanced configuration for this strategy in Client-side caching in Rails: conditional GET requests.
Caching Values
Finally, it is also possible to cache raw values (anything that can be serialized to the cache store). This is usually useful to cache results of resource-intensive or slow operations and avoid performing them again. Identifying a value that can benefit from this caching depends greatly on the application, but usually, looking at your slowest events can help point you in the correct direction Finally, when you identify what to cache, the API that Rails provides for this is very simple to use:
Rails.cache.fetch(cache_key_with_version, expires_in: 12.hours) do
  perform_the_slow_computation
end
The above code will perform_the_slow_computation only once and then cache the value under the cache_key_with_version key. The next time the same code is called, Rails will first check if we already have a cached value and use that instead of triggering perform_the_slow_computation again.
The most important part of this caching strategy is to compute a good cache key that depends on all the inputs used in the value’s computation. This is to ensure we don’t keep using a stale value.
Cache Stores
Now that we know what to cache and the techniques Rails provides to store things in the cache, the next logical question is - where do we cache this data? Rails comes with several in-built cache store adapters. The most popular cache stores for production use cases are Redis and Memcached. There are a couple of other options as well - the file store and memory store. A full discussion of these stores can be found in the post Rails’ built-in cache stores: an overview. File and memory stores can be great for development use to get things up and running quickly. However, they are usually unsuitable for production, especially if you’re working in a distributed setup with multiple servers. Redis and memcached are both suited for production use. Which one you use usually depends on the application.
Background Workers in Ruby on Rails
Most applications need background jobs for mailers, regular clean-ups, or any other time-consuming operation that doesn’t require a user to be present. Chances are, you already have a background worker set up already. Whenever you find yourself doing anything that takes more than a second to do inside controller action, think if you can move it to a background worker instead. This could range from a user-facing operation like searching for data inside a large table to an API’s method that ingests a large amount of data.
Example Implementation
To run custom jobs, Rails provides the Active Job framework. Let’s see how we can use it to move a very complex filtering logic to a background job. First, let’s create our background job:
# jobs/filter_huge_dataset_job.rb
class FilterHugeDatasetJob < ApplicationJob
  queue_as :default

  def perform(user, filters)
    # search your data
  end
end
We can run this job from the controller like this:
# controllers/huge_datasets_controller.rb
class HugeDatasetsController < ApplicationController
  def index
    FilterHugeDatasetJob.perform_later(@current_user, filters)
  end
end
We need to render a loading indicator on our template while we wait for our job to compute data and deliver the results.
But how can we get the results from our job to the view? Turbo makes this really easy. For example, inside the view, we can subscribe for turbo-stream events on a specific notification channel using turbo_stream_from.
Using this, let’s write our templates:
# view/huge_datasets/index.html.erb
<%= render "index", user: @current_user %>
# view/huge_datasets/_index.html.erb
<%= turbo_stream_from user, :huge_datasets %>
<%= render "filters" %>
<div id="data-container">
<% if defined? data %>
<%= render partial: "item", collection: data %>
<% else %>
<%= render "loading" %>
<% end %>
</div>Since data is not defined in the initial controller action, we will only render a loading indicator. Let’s now deliver the results from our job:
# jobs/filter_huge_dataset_job.rb
class FilterHugeDatasetJob < ApplicationJob
  queue_as :default

  def perform(user, filters)
    data = search_huge_dataset(filters)
    notify_completed(user, data)
  end

  def search_huge_dataset(filters)
    # search your data
  end

  def notify_completed(user, data)
    Turbo::StreamsChannel.broadcast_replace_to(
      [user, :huge_datasets],
      target: "data-container",
      partial: "huge_datasets/index",
      locals: { user: user, data: data }
    )
  end
end
The important part here is the notify_completed method. It uses Turbo::StreamsChannel, broadcasting a replace event to the [user, :huge_datasets] notification stream that we subscribed to from our view.
That is everything we need to move complex operations from our controller to background jobs. The main advantage of moving tasks to the background is that background workers can be scaled independently of web servers. This frees up resources on the web server side considerably. For the user, such interfaces also feel much more responsive because we can respond quickly and deliver results incrementally.
Note: If you need help deciding between a background job worker, read Delayed Job vs. Sidekiq: Which Is Better?
Scaling a Database in Your Ruby on Rails Application
The last scalable resource that we will discuss in this post is the database. Databases form the core of most applications. As data and the number of servers accessing that data grows, databases start to feel the load. The easiest way to scale a database is to add more processing power and memory to the database server. As opposed to scaling web servers, doing this with a database is usually a very slow operation, especially if you have high storage. The second option to scale databases is to scale horizontally using multiple databases or by sharding your database. Check out Multiple Databases with Active Record for more details about this. Instead, we’ll focus on optimizing your database’s performance by looking at PostgreSQL.
Find Time-Consuming Queries in PostgreSQL
First, we need to identify our most time-consuming queries. The way we can do that is to query the pg_stat_statements table that contains statistics about all SQL statements executed on the server. Let’s see how we can find the top 100 queries with the highest run times:
SELECT query, calls, (total_exec_time/calls)::integer as avg_time_ms
FROM pg_stat_statements
WHERE calls > 1000
ORDER BY avg_time_ms desc
LIMIT 100;
This will return the query, the number of calls, and the average run time of these queries. Try to find the ones you think could be faster and analyze why they were slow.
You can also run EXPLAIN or EXPLAIN ANALYZE on the query to see the query plan and actual execution details, respectively.
One of the most important things to look out for in the results is Seq Scan, which indicates that Postgres has to go through all the records sequentially to run the query. If this happens, try to bypass that sequential scan by adding an index to the columns that you’ve filtered.
Tables with Most Sequential Scans
Another useful query that I like to run is to find the total number of sequential scans run against a table:
SELECT relname AS name, seq_scan as count
FROM pg_stat_user_tables
ORDER BY seq_scan DESC;
If you see a very large table (with a high number of rows) and a high count value from this result, then you have a problem. Try to check all queries against that table, find ones that can run sequential scans, and add indices to boil that down.
Index Usage
You can also find statistics about index usage by running this query:
SELECT relname,
   CASE idx_scan
     WHEN 0 THEN 'Insufficient data'
     ELSE (100 * idx_scan / (seq_scan + idx_scan))::text
   END percent_of_times_index_used,
   n_live_tup rows_in_table
 FROM
   pg_stat_user_tables
 ORDER BY
   n_live_tup DESC;
This returns the percentage of index usage for each table. A low number means that you are missing some indexes on that table.
Wrap Up
In this post, we explored several strategies to scale your Ruby on Rails applications, including caching and background workers. We also looked at optimizing your PostgreSQL database’s performance. Rails makes it really easy to add several layers of performance optimization to your application. The most important consideration with scalability is to identify bottlenecks in an application before we can act on them. A good performance monitoring tool can help.
Happy coding!
------------------
This article was originally posted on AppSignal Blog